Measuring performance is vital to any mobile marketing efforts. Campaigns don’t happen in a vacuum—you have to determine their return based on specific metrics. Only then can you define what success is. The KPIs (key performance indicators) you choose to focus on depend on your goals and objectives. Universally, there are core mobile app KPIs that most marketers use.
Let’s take a look at the metrics that matter in mobile app marketing.
What Are Mobile App KPIs?
KPIs measure performance. They determine the progress toward an intended outcome. You set the goal and then track your growth against that target. Mobile app KPIs are metrics that allow you to assess the performance of your UA (user acquisition), monetization, or other objectives.
Mobile App KPIs to Track
There are many KPIs you can track. Your goals and strategies will influence these. Some KPIs are essential to all mobile app marketing. Now, we’ll look at what those are, why they are important, and how to calculate them.
There are two specific types of KPIs to consider: quantifying user and channel value and engagement metrics. Each set is important and reflects different insights.
Quantifying User and Channel Value KPIs
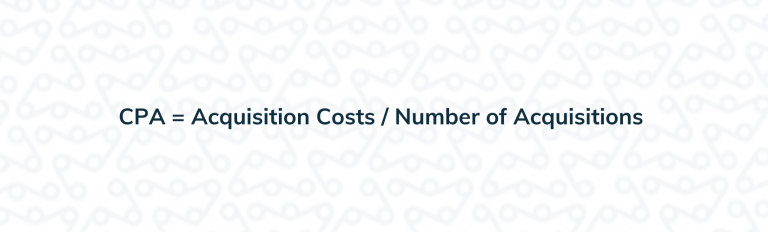
CPA (Cost Per Acquisition)
Acquiring users is fundamental to an app’s success and longevity. Most UA strategies require investment. That investment needs to have returns, and you’ll find this by calculating your CPA. The lower the CPA, the more ROI you’re seeing from campaigns. Tracking this KPI delivers insights on the true value and effectiveness of those campaigns.
CAC (Customer Acquisition Cost)
How much do you have to spend to acquire a customer? By knowing what your CAC, you can more accurately define marketing costs and budget better.

LTV (Lifetime Value)
LTV allows you to assess the individual expected lifetime value of an average user. Lifetime can be different depending on your app. For example, if your app caters to parents with elementary school-age children, the lifetime would be how long they fit into this category.
The components of the equation include:
- How often users make transactions.
- The economic value of those transactions.
- Average length of time that people remain customers (base this on factors like described above as well as including data around retention and churn).
How do you know if LTV is positive? It should be greater than CPA.

Revenue Per User KPIs
To go deeper into LTV, you can use two additional metrics: ARPU (average revenue per user) and ARPPU (average revenue per paying user). These KPIs look at the revenue returns by users as a whole and users that pay.

ROI (Return on Investment)
To determine the total ROI of your marketing efforts, you have to look at gains versus costs. It considers the totality of your mobile app marketing investment.

Engagement KPIs
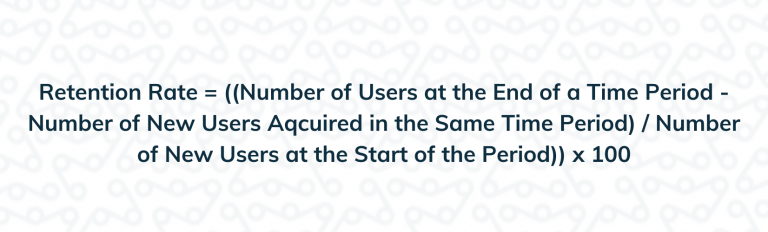
Retention Rate
Retention is vital for any mobile app marketer. Retained users offer tremendous value. They may be more likely to make in-app purchases (IAP), interact with offerwalls, write reviews, and more.
This is a metric to keep a close eye on because if it begins to decrease, this could be an indicator of possible issues with the app experience.
Retention rate is most commonly a ratio of the active users within a certain time period. Typically, you’ll use it to calculate month over month growth. This metric provides insights about engagement and the user experience.
Churn Rate
Churn rate defines how many users you are losing. It’s a compliment to the retention rate. With this formula, you can discern what percentage are abandoning your app. The simple calculation provides you a number, which is a start. But it’s good to have context around churn. Ultimately, you want to figure out why.

Active Users KPIs
Active users is a very meaningful metric. Understanding this tells you how often your users engage with your app. You can calculate it for DAU (daily active users) and MAU (monthly active users). The metric looks at individual users, not sessions. Fluctuations in DAU and MAU can shed light on engagement, loyalty, and UX.

Daily Sessions Per DAU
Daily sessions per DAU look at user behavior more closely, focusing on the number of times they open the app in a day. This KPI highlights the “necessity” of the app to a user.

Return Rate
Return rate is the “stickiness” of your app. It gives you clarity around how often users return. The higher the percentage, the more your users keep coming back. It’s a ratio of DAU and MAU. The closer DAU is to MAU, the stickier your app is.

Are You Tracking these Mobile App KPIs?
If you don’t measure it, you can’t improve it. These essential KPIs will provide you with valuable insight around engagement, UX, and revenue generation. Over time, you’ll see trends and patterns that can lead to better decision-making around mobile app marketing.
Have questions about your KPIs? Want to improve them? AdAction can help. Talk to our mobile app experts today!